Goal
After reading this article
you'll
- understand what a data point is
- know how to create a data point in flowchart view
- know how to review and export data points
Summary
A data point is effective in recording decisions, this helpdoc demonstrated what they are, how to create and export them.
| Name | Data Points |
| Benefit | Allows you to visually see player data and track real-time responses Enables you to filter by teams and players. |
| Features |
|
What is a Data Point
Data points allow the facilitator to visually represent and monitor the choices made by the participants.
*Note that the response report contains ALL clicked questions, not just data points*
How to Create a Data Point
1. With the content item selected, click the chart icon to add a new data point. | 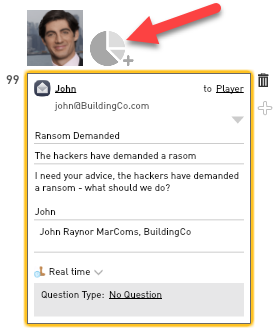 |
2. Change the name of the data point 3. Then chose your question by clicking Question Type | 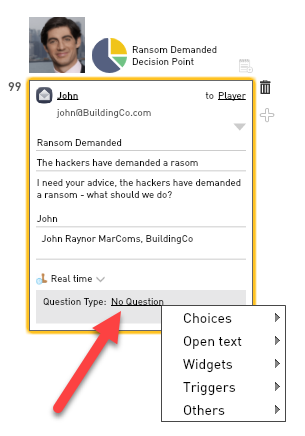 |
Reviewing Data Points Live
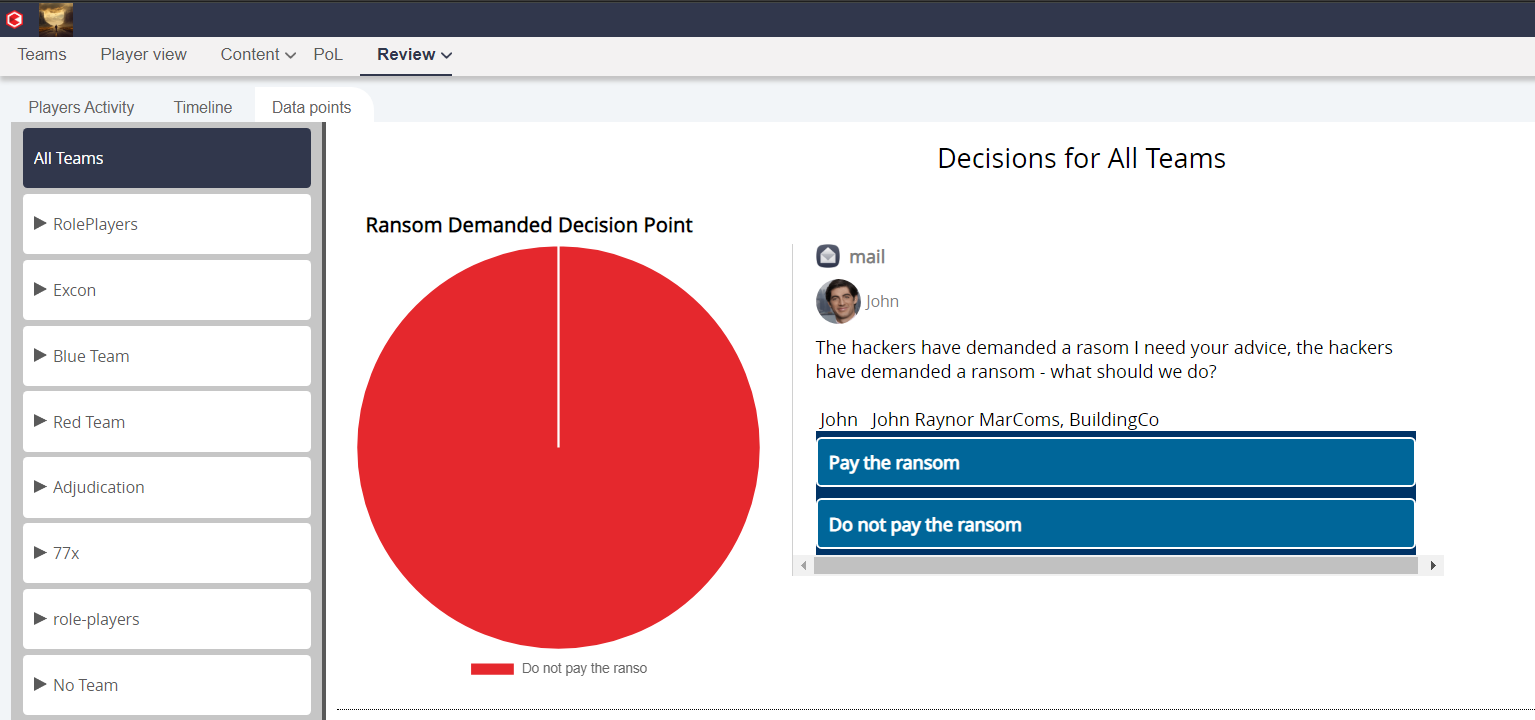
You can view live decisions in the facilitators dashboard via Review > Data points.
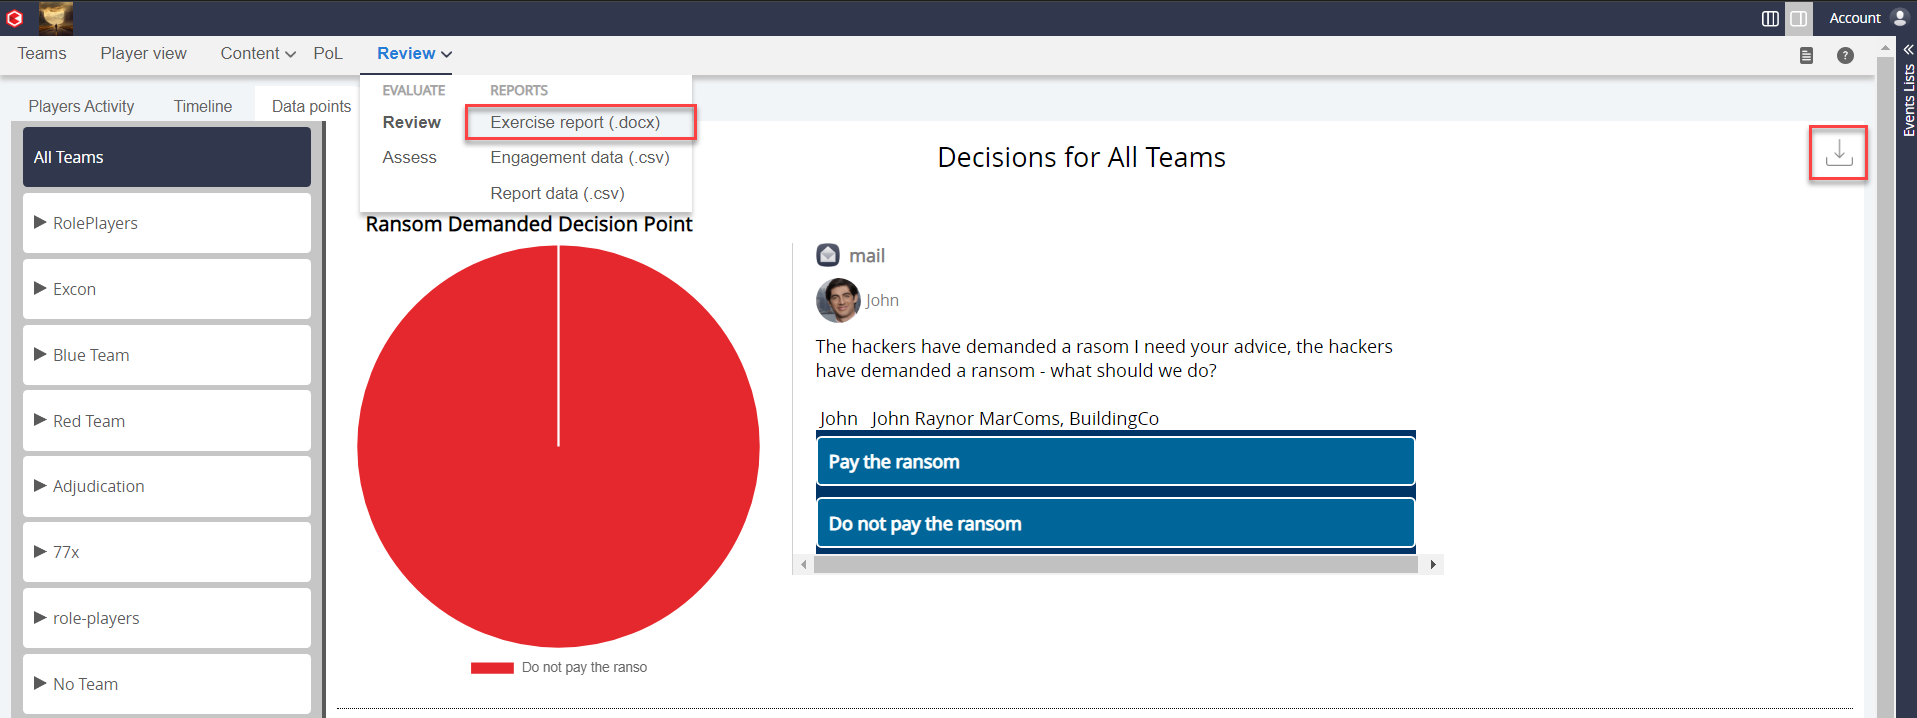
Here you have the option to review the decision points through a timeline or a pie chart. To access the pie chart navigate to Review > Data points.
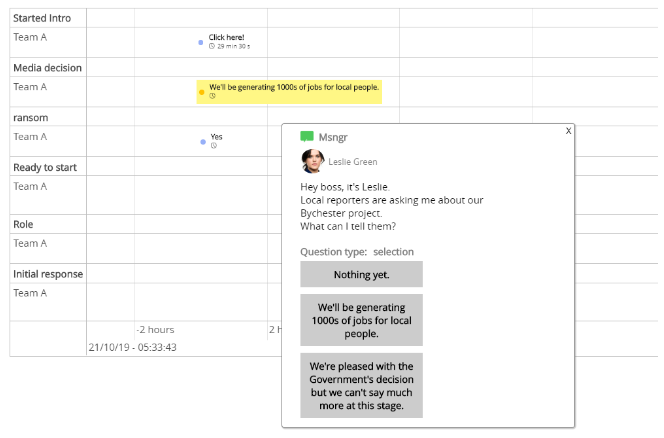
Alternatively, you can view your data points on a timeline. The timeline is effective for showing players and teams activity in response times.
To view the data points on the timeline navigate to Review > Timeline.
Exporting Data Points
To export your data points into a word document navigate to Review > Exercise report.
To export the decisions into a pdf, navigate to the download button on the right.