
This article is related to
Conducttr Worlds. If you are looking for
information related to any of the other
Conducttr licences (Dove, Raven, Hawk or
Osprey) and how to create scenarios please
check this
link.
Goal
After reading this article
you'll:
- know where to locate your metrics
- understand what each metric represents
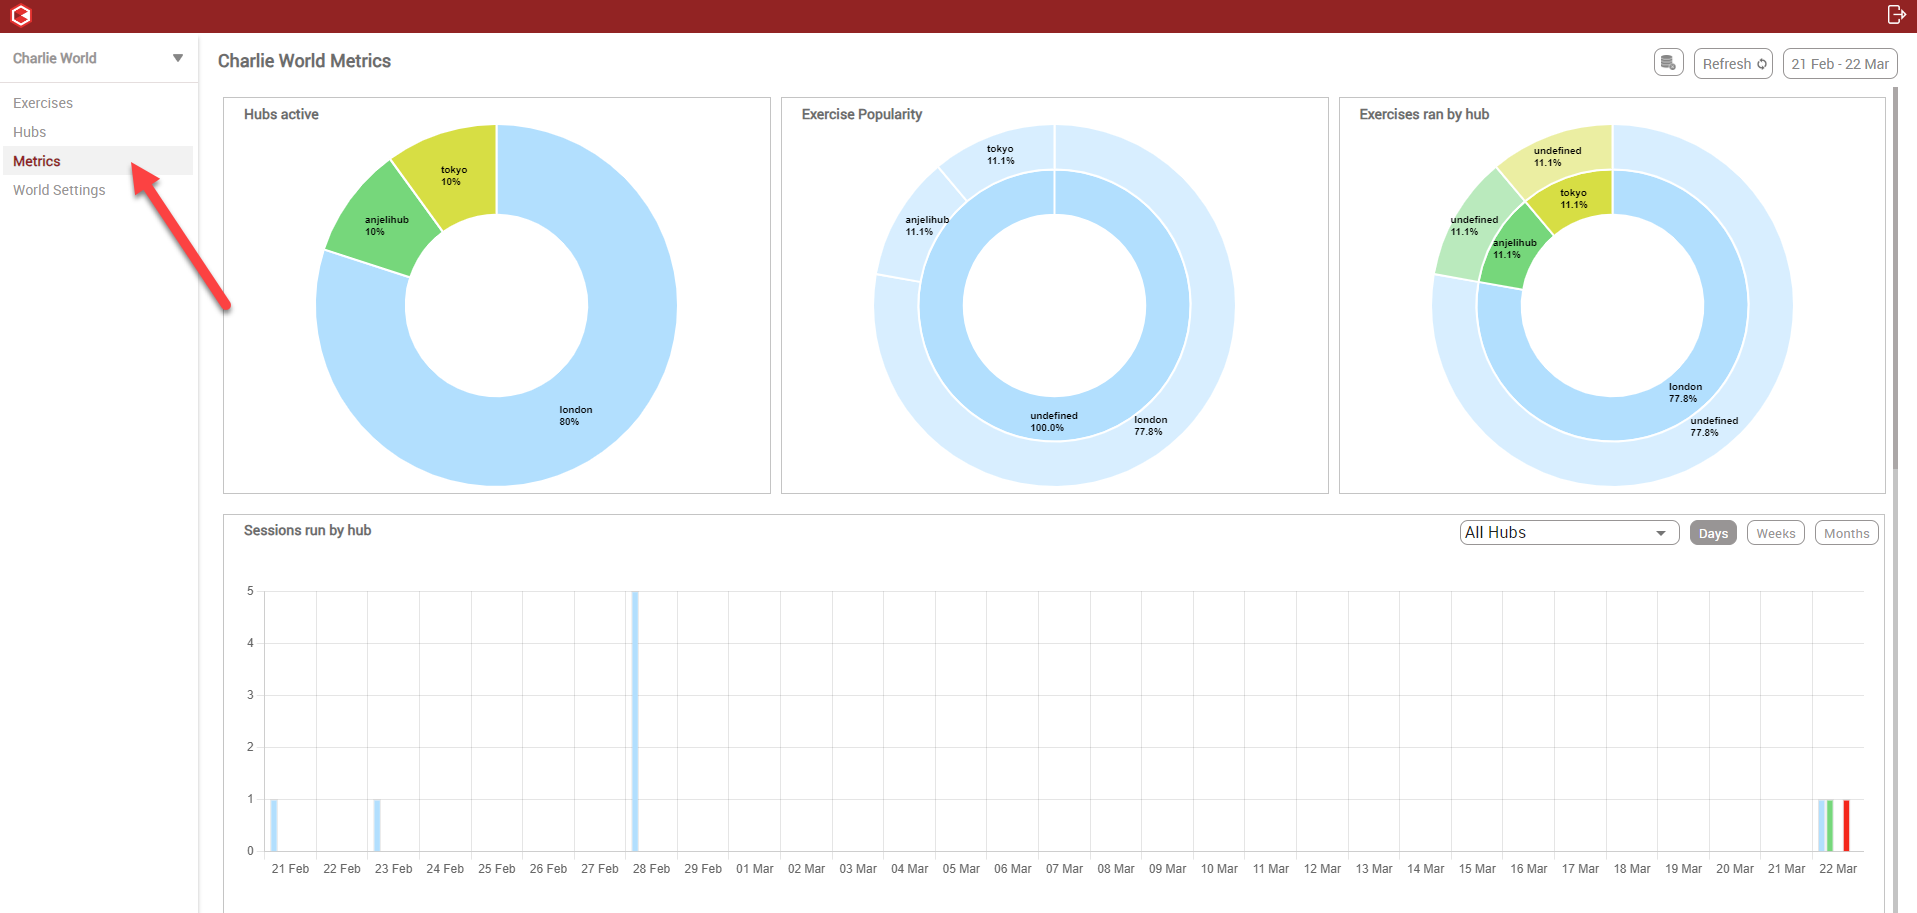
Locating Metrics
Navigate to your World > Metrics
Defining Metrics
Hubs Active
| 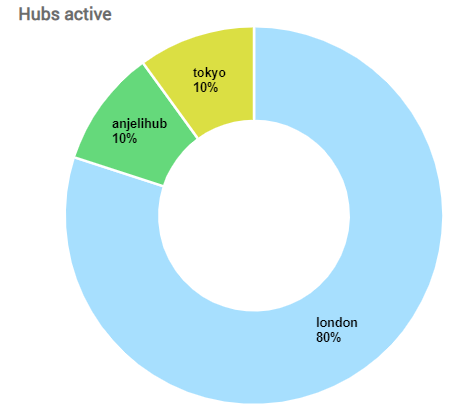 |
Exercise Popularity
| 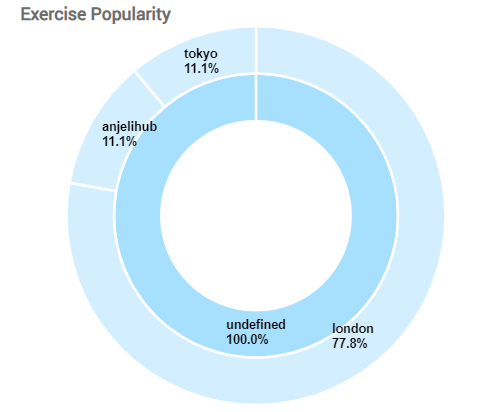 |
Exercises ran by hubs
| 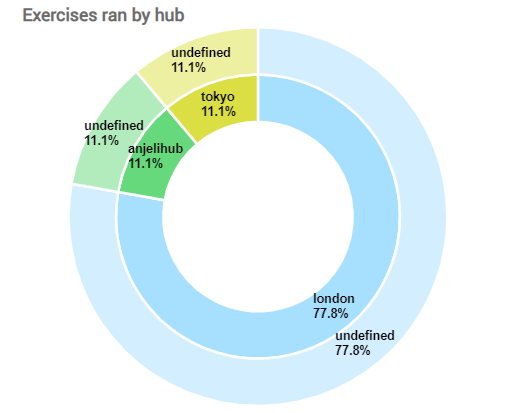 |
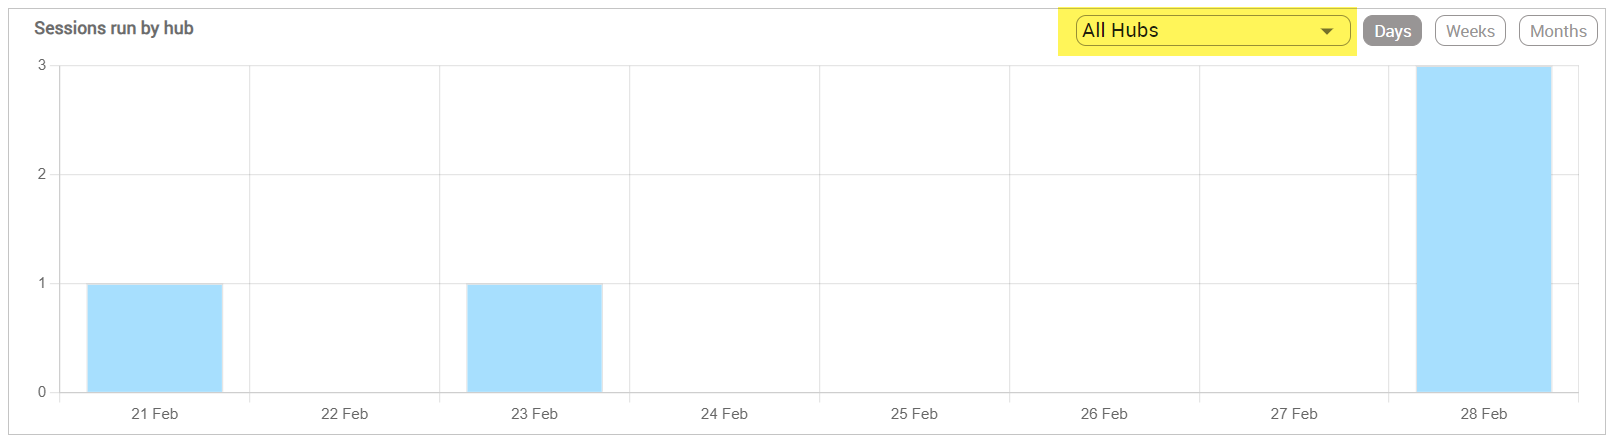
Sessions run by Hubs
|  |
Progression Chart Displays two different views that allow users to see hubs engagement with exercise milestones. a. Hubs per Milestone
b. Completion Time
| Hubs per Milestone 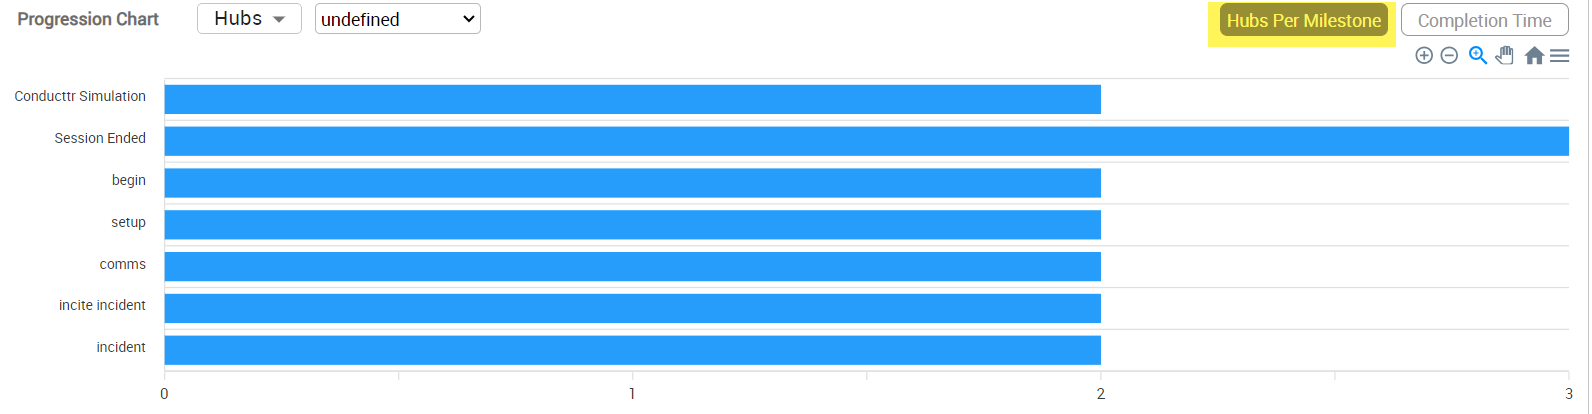 Completion Time 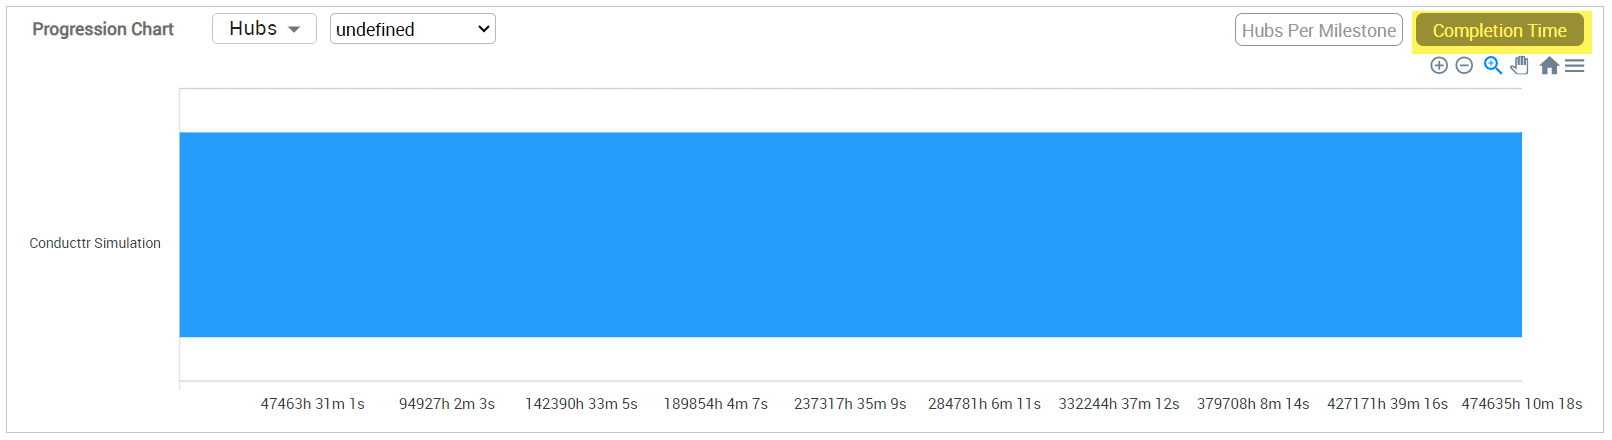 |
Completion Chart Users can see how hubs engage with a specific exercise through the completion chart, which integrates two types of pie charts: a. Start Rate
b. Completion Rate
Filter by exercises and hubs. | 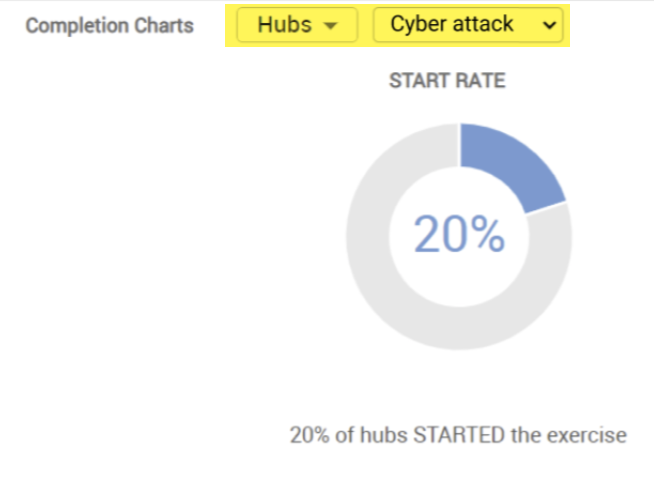 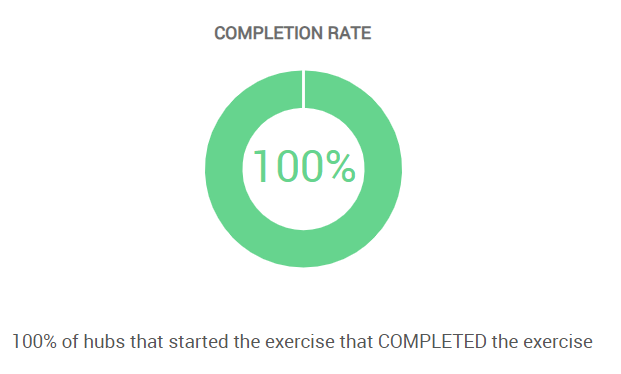 |